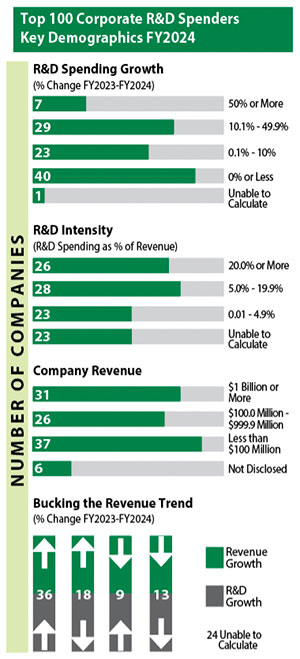
Canada's Top 100 Corporate R&D Spenders posted $15.39 billion in combined research and development (R&D) spending in Fiscal 2024. This was a decrease of -1.5% over Fiscal 2023 for the 99 that provided complete data. R&D spending increased at 59 companies, declined at 40. Combined revenue of 93 of the Top 100 that disclosed their data was $353.73 billion. This produced an overall R&D intensity (R&D spending as % of revenue) of 3.8% in Fiscal 2024.
The leading corporate R&D spender was again Shopify Inc., devoting $1.87 billion to R&D, a decrease of -19.8%), followed by Open Text Corporation moving into second spot with $1.22 billion (up 33.3%). Magna International Inc. dropped to third spot with $1.20 billion of spending (up 2.9%). Bausch Health Companies Inc. maintained 4th place with $843.8 million (up 3.5%) and AMD Canada rounded out the top five R&D spenders with $751.7 million (down -1.5%).
$100 Million Club
Thirty-three (33) Top 100 firms each reported R&D spending in excess of $100 million in Fiscal 2024, thus qualifying for membership in Research Infosource's $100 Million Club. Total Club members' R&D spending was $13.54 billion, accounting for 88% of total Top 100 R&D spending in Fiscal 2024.
R&D spenders tiers
Grouping the Top 100 companies into three R&D spending tiers (Tier 1 = $100 million or more of R&D spending, Tier 2 = $25 million-$99.9 million, Tier 3 = less than $25 million), three firms emerged as the respective tier leaders: Tier 1 - Shopify Inc. ($1.87 billion), Tier 2 - AstraZeneca Canada Inc. ($97.5 million) and Tier 3 - Computer Modelling Group Ltd. ($24.0 million).
R&D spending growth
In Fiscal 2024, the leading firms for growth in R&D spending in Tier 1 were: Imperial Oil Limited (40.5%), Open Text Corporation (33.3%) and Celestica Inc. (30.0%). The Tier 2 leaders were BriaCell Therapeutics Corp. (79.8%), Cameco Corporation (73.7%) and Rio Tinto Iron & Titanium Inc (66.0%). Tier 3 R&D growth leaders were: Satellos Bioscience Inc. (122.3%), Verses AI Inc. (107.5%) and NervGen Pharma Corp. (95.5%).
R&D intensity
Combined Top 100 R&D intensity (R&D spending as a percent of revenue) was 3.8% in Fiscal 2024. Among the 93 firms providing complete data for analysis, several posted very strong gains in R&D intensity. In Tier 1, the leading firms were: AbCellera Biologics Inc. (580.1%), Repare Therapeutics Inc. (218.5%) and Zymeworks Inc. (176.4%). Tier 2 leaders were: Thinkific Labs Inc. (28.5%), Coveo Solutions Inc. (28.4%) and D2L Inc. (22.7%). Heading Tier 3 were: Conavi Medical Corp. (830.2%), Verses AI Inc. (611.4%) and Spectra7 Microsystems Inc. (193.4%).
Regional performance
In Fiscal 2024, 49 companies headquartered in Ontario reported combined R&D spending of $9.07 billion, representing 59% of the Top 100 total, followed by 21 Quebec-based companies ($4.10 billion, 27% of the total) and 28 firms located in Western Canada ($2.21 billion, 14% of the total). Overall R&D growth dropped by a combined -0.6% in Ontario, -3.8% in Quebec and -0.8% in Western Canada.
Industry performance
Top 100 - Leading Industries
Industry
% of Total
Software & Computer Services (25)
34
Pharmaceuticals/Biotechnology (29)
17
Telecommunications Services (4)
13
Aerospace & Defence (5)
8
Automotive (2)
8
A selection of industry sectors led R&D spending: 25 companies within the Software & Computer Services sector accounted for 34% of the total Top 100 R&D spending; 29 firms in Pharmaceuticals/Biotechnology combined for 17%; four in Telecommunications Services accounted for 13%, while Aerospace & Defence, with five companies, and Automotive, with two companies, accounted for 8% each. Two companies in Computer Equipment accounted for 5% and four companies in the Comm/Telecom Equipment sector made up 4% of all R&D spending.
Among these sectors Comm/Telecom Equipment had a combined positive R&D spending growth of 4.7%, as did Automotive (up 3.1%) in Fiscal 2024. There was basically flat R&D spending growth in Aerospace & Defence (up 0.9%) and Pharmaceutical/Biotechnology (up 0.6%). Computer Equipment, Software & Computer Services and Telecommunications Services each had a decline in R&D spending (-1.0%, -2.9% and -3.4 respectively).
Bucking the trend
Normally, Research Infosource anticipates R&D spending trends to broadly align with revenue trends. However, in Fiscal 2024, several industry sectors diverged from these expectations: the Software & Computer Services sector experienced a combined revenue increase of 14.9%, while posting a drop in combined R&D spending of -2.9%. The Telecommunications Services sector had positive revenue gains of 2.2%, against negative growth of combined R&D spending of -3.4%. The Pharmaceutical/Biotechnology sector increased revenues by 10.6%, while posting a flat combined R&D spending increase of 0.6%. Similarly, the Aerospace & Defence sector posted a combined revenue increase of 8.5%, against a flat R&D spending increase of only 0.9%. However, revenues for the Energy/Oil & Gas sector declined (-4.6%), while increasing its combined R&D spending by 22.4%.
This year and next
Last year, we forecasted that "economic and business conditions prevailing in Fiscal 2023 will drive R&D results for Fiscal 2024… to another strong round of spending". Clearly, events have proved us wrong. Based on the Fiscal 2024 results, the corporate sector is beginning to face economic headwinds for research, even though revenue growth was, on balance, positive. Most of our R&D spending indicators are down, or at best flat.
Given the country's current economic challenges - no need to elaborate - prospects for Fiscal 2025 are not good. Political considerations are putting a chill on U.S. multinationals' R&D spending plans in Canada (and undoubtedly in other countries as well). Financial uncertainty is simultaneously constraining domestic investment in research.
Short term prospects may be dim, but given the resilience of Canadian companies and entrepreneurs, we can be confident that there will be light at the end of the tunnel.
Top Corporate R&D Spenders by Tier FY2024
R&D Spending
Rank
Tier 1
$000
1
Shopify Inc.
$1,872,517
2
Open Text Corporation
$1,224,508
3
Magna International Inc.
$1,197,205
Rank
Tier 2
$000
1
AstraZeneca Canada Inc. (fs)
$97,470
2
Enghouse Systems Limited
$88,833
3
Rio Tinto Iron & Titanium Inc. (fs)
$82,979
Rank
Tier 3
$000
1
Computer Modelling Group Ltd.
$24,025
2
Knight Therapeutics Inc.
$23,304
3
Neo Performance Materials Inc.
$23,107
R&D Spending Growth
(% Change FY2023-FY2024)
Rank
Tier 1
%
1
Imperial Oil Limited
40.5
2
Open Text Corporation
33.3
3
Celestica Inc.
30.0
Rank
Tier 2
%
1
BriaCell Therapeutics Corp.
79.8
2
Cameco Corporation
73.7
3
Rio Tinto Iron & Titanium Inc. (fs)
66.0
Rank
Tier 3
%
1
Satellos Bioscience Inc.
122.3
2
Verses AI Inc.
107.5
3
NervGen Pharma Corp.
95.5
R&D Intensity*
(R&D Spending as % of Revenue)
Rank
Tier 1
%
1
AbCellera Biologics Inc.
580.1
2
Repare Therapeutics Inc.
218.5
3
Zymeworks Inc.
176.4
Rank
Tier 2
%
1
Thinkific Labs Inc.
28.5
2
Coveo Solutions Inc.
28.4
3
D2L Inc.
22.7
Rank
Tier 3
%
1
Conavi Medical Corp.
830.2
2
Verses AI Inc.
611.4
3
Spectra7 Microsystems Inc.
193.4
Notes:
1. R&D Spending Tiers: Tier 1 = $100 million or more of R&D spending, Tier 2 = $25 million-$99.9 million, Tier 3 = less than $25 million.
fs = Foreign subsidiary (included revenue and R&D spending for Canadian operations only) *Based on companies with $2 million or more of revenue